Results & outcomes
Hypothesis 1
The first hypothesis was that functional connectivity differs between depressed patients and healthy controls.
Hypothesis 2
The second hypothesis was that replicating the methods that were used in the original study but using different analysis and preprocessing tools (mriqc, Nilearn, Nipype) would lead to different results regarding the differences in functional connectivity between depressed patients and healthy controls.
Results of the original study
At first the main results of Bezmaternykh et al. (2021) regarding the differences in functional connectivity between the two groups were evaluated. Bezmaternykh et al. (2021) performed an ICA (Table 2) and afterwards looked for connectivity differences (Table 3 & Figure 1) between the depressed and control group. They found decreased functional connectivity within the default mode network (DMN) which is not inline with the majority of other studies in this field. Moreover, a global increase of functional connectivity was found in the depressive group between the DMN and the executive control network (ECN). This is also not a typical finding for patients with depression. Another notable result was the overconnectivity of the medial visual cortex (mVis) with the audial cortex (AN) in the depressive group.
Table 1: ICA depressed vs. controls (Bezmaternykh et al., 2021, p. 5)
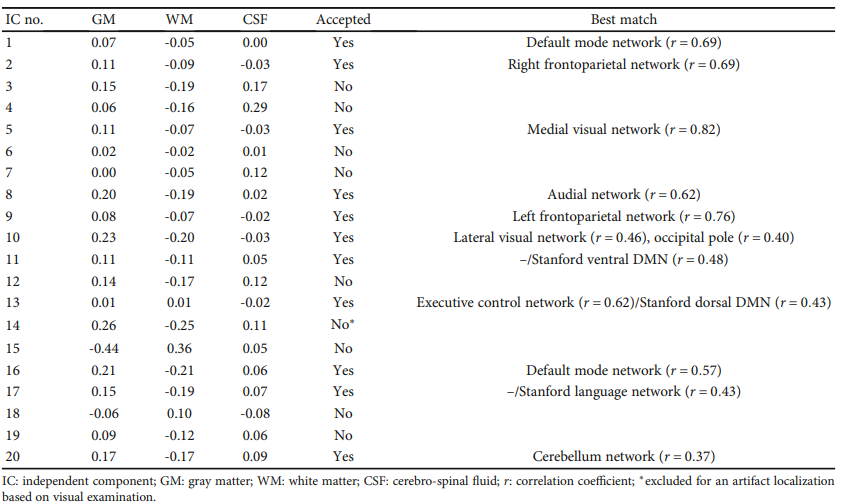
Table 2: Results of depressed vs. controls coparison in all cases (left part) and in cases correlated with 6 solid body motion parameters less than r=0.4 on individual level (right part) (Bezmaternykh et al., 2021, p. 6)
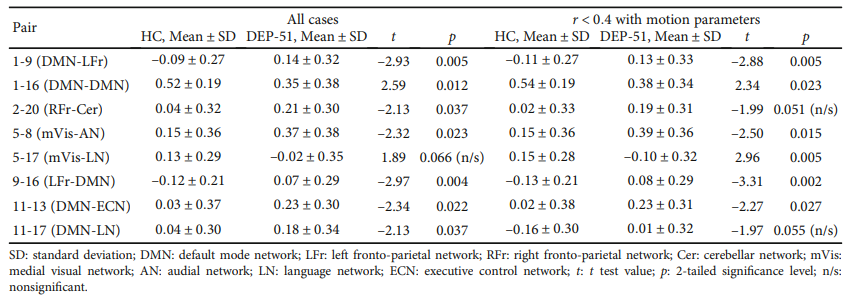
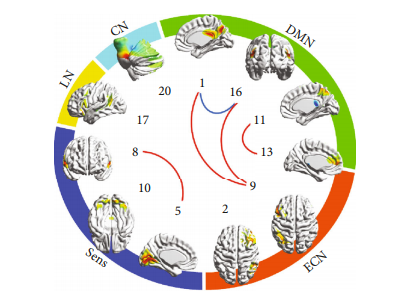
Figure 1: Results of depressed vs. controls comparison (Bezmaternykh et al. 2021, p. 6). Blue lines show pairs with more connectivity in controls, red lines show pairs with more connectivity in depressed patients (p < 0.05 uncorrected).
Results of our analysis
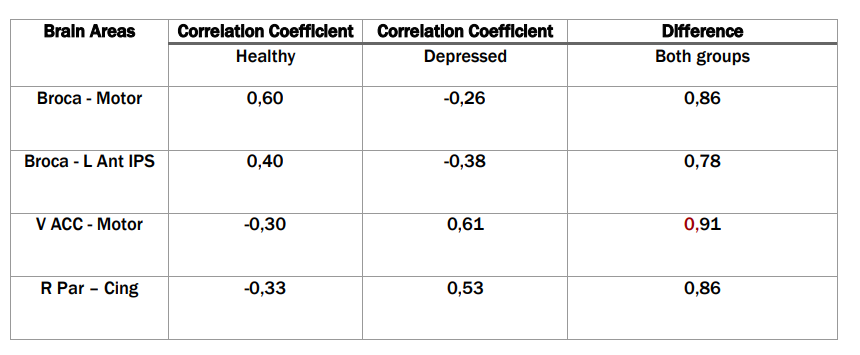
In the table below the areas are listed that showed the biggest correlation coefficient differences when comparing both groups.
Table 4: Group comparison of the most important brain areas of the analysis
To compare our results with the results of (Bezmaternykh et al., 2021) we needed to categorize the brain areas into the networks they belong to.
Motor was categorized as sensorimotor network.
L Ant IPS was categorized as dorsal attention network.
Cing was categorized as default mode network.
V ACC was categorized as salience network.
R Par was categorized as default mode network.
Broca was categorized as language network.
The most significant percentage of discrepancies showed differences in several areas like motor cortex (Motor), Broca’s area (Broca), ventral anterior cingulate cortex (V ACC), cingulate cortex (Cing), left intraparietal sulcus (L Ant IPS) and right parahippocampal gyrus (R Par). We found higher correlation coefficients in depressive subjects between the saliency network and the sensorimotor network (V ACC – Motor). Also, there was a higher correlation in the depressive group within the DMN for R Par – Cing. Higher corrleation coefficients for the healthy group were found between the language network and the sensorimotor network (Broca - Motor)and between the language network and the dorsal attention network (Broca - L Ant IPS).
The table below displays the correlation coefficient differences within the default mode network (DMN).
Table 5: Connectivity results - DMN

When looking at broader areas rather than specific regions in the DMN, a higher correlation coefficient in the healthy group could be found for L DMN - Front DMN, L DMN - R DMN and Med DMN - Front DMN. For the other areas the correlation ceofficient difference was too small to be considered as a difference in connectivity between the two groups.
Discussion
First, it was hypothesized that functional connectivity differs between depressed patients and healthy controls. This hypothesis is seen as confirmed because big differences in correlation were found for multiple brain areas Differences between the two groups are in line with Bezmaternykh et al. (2021) as well as with further studies. The second hypothesis was that the use of different preprocessing and analysis tools would lead to different results. This hypothesis was confirmed too. Bezmaternykh et al. (2021) found decreased connectivity for the depressed group within the default mode network (DMN). This was not completely the case in this analysis. DMN connectivity (R Par – Cing) was increased in the depressed group. This finding is in line with further studies (Dai et al., 2019). When looking at broader areas rather than specific regions in the DMN, a higher correlation coefficient in the healthy group could be found for L DMN - Front DMN, L DMN - R DMN and Med DMN - Front DMN. Decreased functional connectivity within the DMN in the group of healthy subjects is not in line with other studies in this field (Dai et al., 2019) but confirms the results of Bezmaternykh et al. (2021). Furthermore, big correlation coefficient differences were found between the groups for areas from the language network with the sensorimotor network (Broca - Motor), between the language network and the dorsal attention network (Broca - L Ant IPS) and the salience network and the sensorimotor network (V ACC - Motor). These results were not found in the original study. Dai et al. (2019) report findings that highlight the importance of the salience network connectivity in the pathogenesis of depression and describe enhanced functional connectivity between the default mode network and the salience network. These findings cannot be found in this way in this analysis. Abnormal connectivity of the sensorimotor network in patients with depressive symptoms in supported by other studies. Doucet et al. (2017) and Martino et al. (2016) report findings where they found abnormalities regarding this network in bipolar patients during depressive phases. But in contrast to the findings in our analysis this connectivity differences were found in relation to the DMN and not to the language network or the salience network. Differences in connectivity within the language network were found by Buchanan et al. (2014) in women with major depressive disorder in a resting state fMRI study. This hints at the language network connectivity playing a role in depression but it is not exactly what was found in our analysis.
Conclusion
In conclusion, functional brain connectivity differs between healthy and depressed subjects. This can be found in this study as well as in the study by Bezmaternykh et al. (2021) . However, the try replicate the concrete differences with different tools, was unsuccessful. Further connectivity differences were found but the trend that connectivity within the DMN is not increased in depressed patients as further literature would suggest (Dai et al., 2019) is confirmed.